CISS IT Training

Business Dashboard and Reporting Guide for Better Decisions

Business dashboards convert daily activity into clear numbers, reports and insights.

Cyber Impulse Team02 May 20265 min read
Business Dashboard and Reporting Guide for Better Decisions cover image

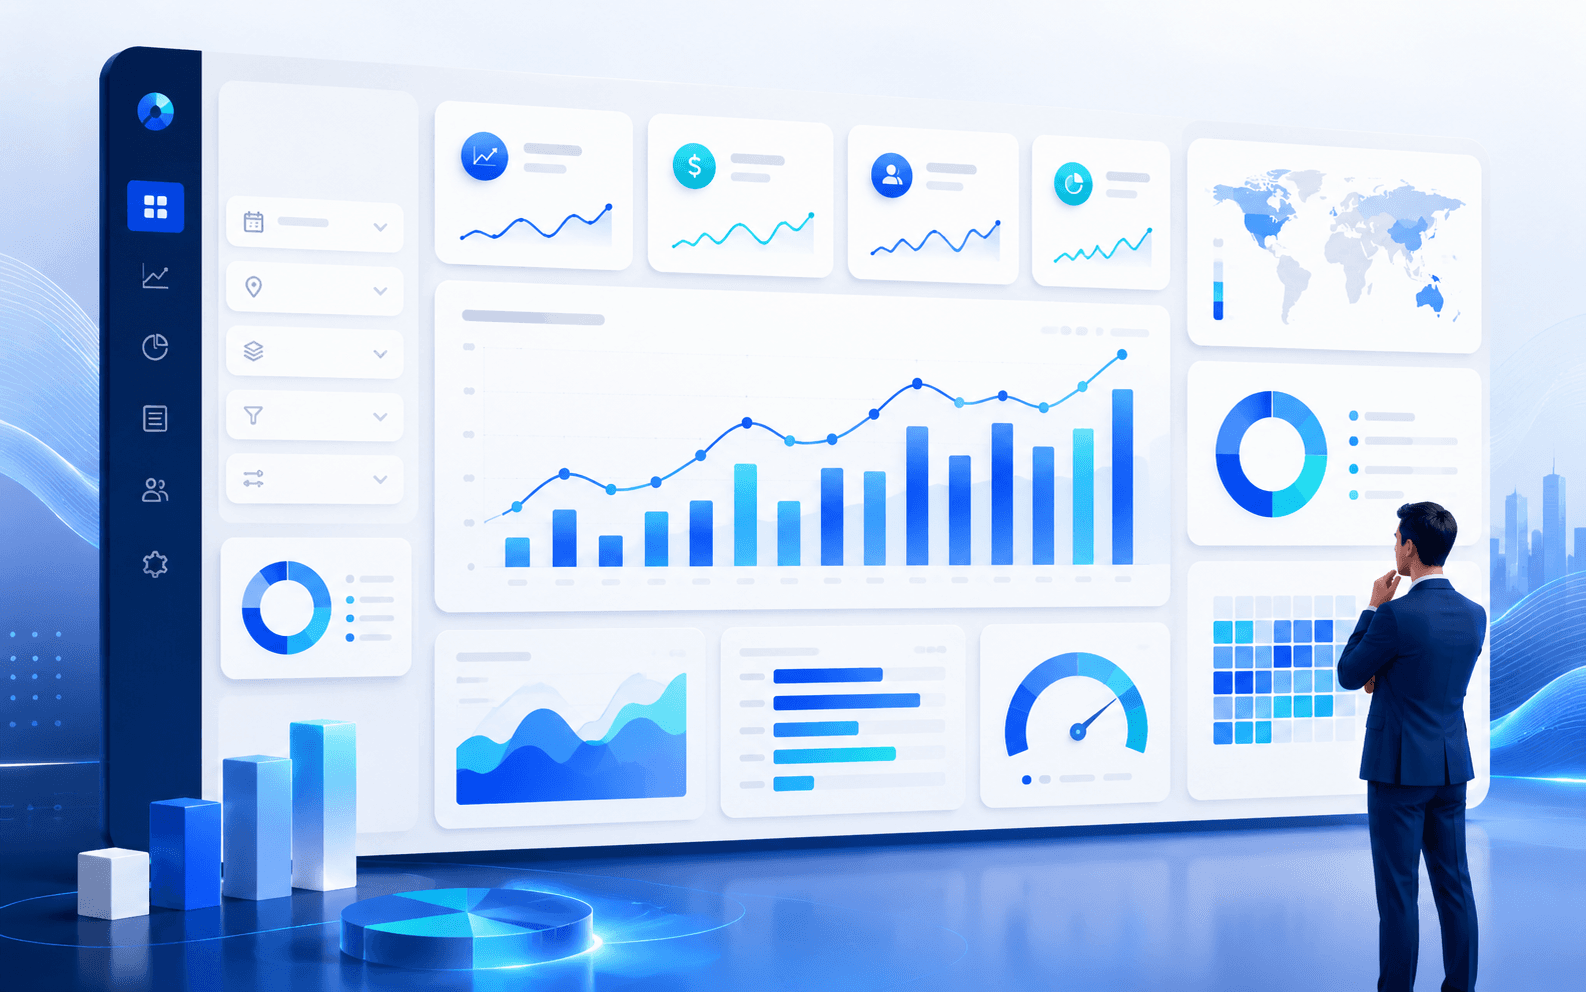
Dashboards help businesses track sales, users, leads, performance, payments, inventory and operational reports in one clean view.

01

Show important data first

Dashboards should highlight totals, trends, pending actions and important alerts.

02

Use filters and reports

Date filters, category filters, status filters and export-ready reports make dashboards useful for teams.

03

Connect with business workflow

Dashboards should not be separate from the system. They should reflect real orders, leads, payments, users and activity.

Related topics

ReportsDashboardAnalyticsERP

Learn the topic practically

Turn technology insights into practical project skills.

Explore courses

Turn technical reading into practical learning.

Use technical articles as supporting resources alongside structured learning, coding practice and project implementation.

How can I apply the ideas from this article?

Identify the main concept, note the practical steps and apply them in a small exercise or existing project. Practical implementation is the best way to test your understanding.

Where should I continue learning after this article?

Follow the related technology or course pages for a more structured learning path, and use project examples to understand how the topic connects with complete applications.

Should I verify technical details before using them in production?

Yes. Technology changes over time, so production decisions should also be checked against current official documentation, project requirements and security considerations.